Kinase-substrate annotation prioritisation heatmap
Source:R/kinaseSubstratePrediction.R
kinaseSubstrateHeatmap.RdKinase-substrate annotation prioritisation heatmap
kinaseSubstrateHeatmap(
  phosScoringMatrices,
  top = 3,
  printPlot = NULL,
  filePath = "./kinaseSubstrateHeatmap.pdf",
  width = 10,
  height = 10
)
Arguments
- phosScoringMatrices
a matrix returned from kinaseSubstrateScore.
- top
the number of top ranked phosphosites for each kinase to be included in the heatmap. Default is 1.
- printPlot
indicate whether the plot should be saved as a PDF in the specified directory. Default is NULL, otherwise specify TRUE.
- filePath
path name to save the plot as a PDF file. Default saves in the working directory.
- width
width of PDF.
- height
height of PDF.
Value
a pheatmap object.
Examples
# \donttest{
data('phospho_L6_ratio_pe')
data('SPSs')
data('PhosphoSitePlus')
ppe <- phospho.L6.ratio.pe
sites = paste(sapply(GeneSymbol(ppe), function(x)x),";",
sapply(Residue(ppe), function(x)x),
sapply(Site(ppe), function(x)x),
";", sep = "")
grps = gsub("_.+", "", colnames(ppe))
design = model.matrix(~ grps - 1)
ctl = which(sites %in% SPSs)
ppe = RUVphospho(ppe, M = design, k = 3, ctl = ctl)
phosphoL6 = SummarizedExperiment::assay(ppe, "normalised")
# filter for up-regulated phosphosites
phosphoL6.mean <- meanAbundance(phosphoL6, grps = grps)
aov <- matANOVA(mat=phosphoL6, grps = grps)
idx <- (aov < 0.05) & (rowSums(phosphoL6.mean > 0.5) > 0)
phosphoL6.reg <- phosphoL6[idx, ,drop = FALSE]
L6.phos.std <- standardise(phosphoL6.reg)
rownames(L6.phos.std) <- paste0(GeneSymbol(ppe), ";", Residue(ppe),
Site(ppe), ";")[idx]
L6.phos.seq <- Sequence(ppe)[idx]
L6.matrices <- kinaseSubstrateScore(PhosphoSite.mouse, L6.phos.std,
L6.phos.seq, numMotif = 5, numSub = 1)
#> Number of kinases passed motif size filtering: 114
#> Number of kinases passed profile size filtering: 44
#> Scoring phosphosites against kinase motifs:
#> 1.
#> 2.
#> 3.
#> 4.
#> 5.
#> 6.
#> 7.
#> 8.
#> 9.
#> 10.
#> 11.
#> 12.
#> 13.
#> 14.
#> 15.
#> 16.
#> 17.
#> 18.
#> 19.
#> 20.
#> 21.
#> 22.
#> 23.
#> 24.
#> 25.
#> 26.
#> 27.
#> 28.
#> 29.
#> 30.
#> 31.
#> 32.
#> 33.
#> 34.
#> 35.
#> 36.
#> 37.
#> 38.
#> 39.
#> 40.
#> 41.
#> 42.
#> 43.
#> 44.
#> 45.
#> 46.
#> 47.
#> 48.
#> 49.
#> 50.
#> 51.
#> 52.
#> 53.
#> 54.
#> 55.
#> 56.
#> 57.
#> 58.
#> 59.
#> 60.
#> 61.
#> 62.
#> 63.
#> 64.
#> 65.
#> 66.
#> 67.
#> 68.
#> 69.
#> 70.
#> 71.
#> 72.
#> 73.
#> 74.
#> 75.
#> 76.
#> 77.
#> 78.
#> 79.
#> 80.
#> 81.
#> 82.
#> 83.
#> 84.
#> 85.
#> 86.
#> 87.
#> 88.
#> 89.
#> 90.
#> 91.
#> 92.
#> 93.
#> 94.
#> 95.
#> 96.
#> 97.
#> 98.
#> 99.
#> 100.
#> 101.
#> 102.
#> 103.
#> 104.
#> 105.
#> 106.
#> 107.
#> 108.
#> 109.
#> 110.
#> 111.
#> 112.
#> 113.
#> 114.
#> done.
#> Scoring phosphosites against kinase-substrate profiles:
#> done.
#> Generating combined scores for phosphosites
#> by motifs and phospho profiles:
#> done.
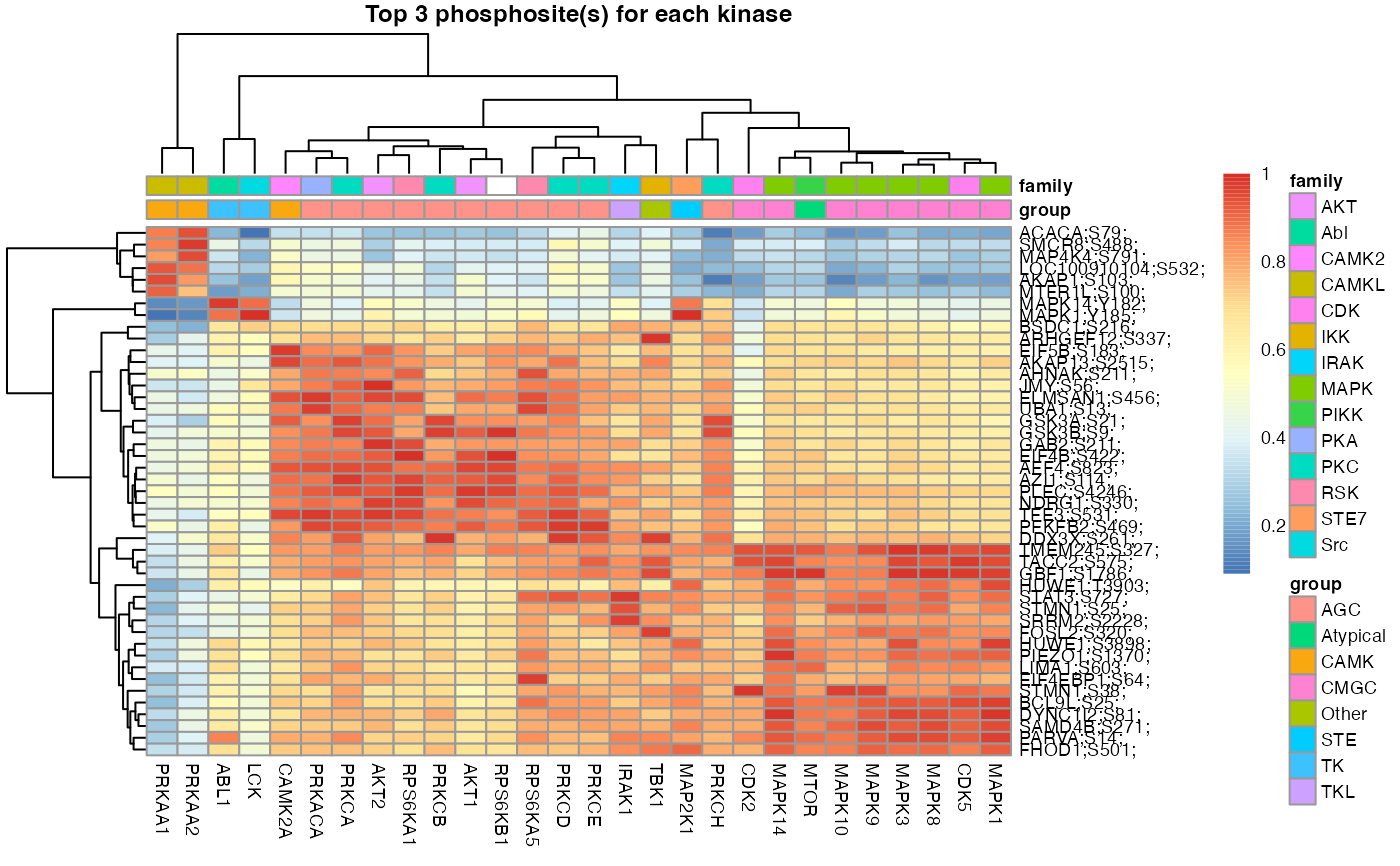 kinaseSubstrateHeatmap(L6.matrices)
 kinaseSubstrateHeatmap(L6.matrices, printPlot=TRUE)
#> pdf
#> 3
# }
kinaseSubstrateHeatmap(L6.matrices, printPlot=TRUE)
#> pdf
#> 3
# }