Plot densities
plotDensities(
  x,
  cepoOutput,
  nGenes = 2,
  assay = "logcounts",
  celltypeColumn,
  celltype = NULL,
  genes = NULL,
  plotType = c("histogram", "density"),
  color = NULL
)
Arguments
- x
a
SummarizedExperimentor aSingleCellExperimentobject.- cepoOutput
an output from Cepo or doLimma/doVoom/doTtest/doWilcoxon functions
- nGenes
number of top genes from each celltype to plot. Default to 2.
- assay
a character ('logcounts' by default), indicating the name of the assays(x) element which stores the expression data (i.e., assays(x)$name_assays_expression). We strongly encourage using normalized data, such as counts per million (CPM) or log-CPM.
- celltypeColumn
a character, indicating the name of the name of the cell type column in the colData(x).
- celltype
a character, indicating the name of the cell type to plot. Default is NULL which selects all celltypes in the cepoOutput.
- genes
a character vector, indicating the name of the genes to plot. Default to NULL, so that 2 top genes from each celltype will be plotted.
- plotType
Either 'histogram' or 'density'
- color
a named color vector. The names should correspond to the
celltypeargument above
Value
A ggplot object
with cell-type specific densities for a gene.
A ggplot object.
Examples
library(SingleCellExperiment)
data('cellbench', package = 'Cepo')
cellbench
#> class: SingleCellExperiment
#> dim: 894 895
#> metadata(3): scPipe Biomart log.exprs.offset
#> assays(2): counts logcounts
#> rownames(894): AP000902.1 TNNI3 ... SCMH1 IGF2BP2
#> rowData names(0):
#> colnames(895): CELL_000001 CELL_000003 ... CELL_000955 CELL_000965
#> colData names(17): unaligned aligned_unmapped ... sizeFactor celltype
#> reducedDimNames(0):
#> mainExpName: NULL
#> altExpNames(0):
cepoOutput <- Cepo(logcounts(cellbench), cellbench$celltype)
plotDensities(
x = cellbench,
cepoOutput = cepoOutput,
assay = 'logcounts',
plotType = 'histogram',
celltypeColumn = 'celltype'
)
#> AC092447.7, CT45A3, HLA-DRB6, AR, CASC9, AC011632.1 will be plotted
#> Warning: The dot-dot notation (`..density..`) was deprecated in ggplot2 3.4.0.
#> ℹ Please use `after_stat(density)` instead.
#> ℹ The deprecated feature was likely used in the Cepo package.
#> Please report the issue at <https://github.com/PYangLab/Cepo/issues>.
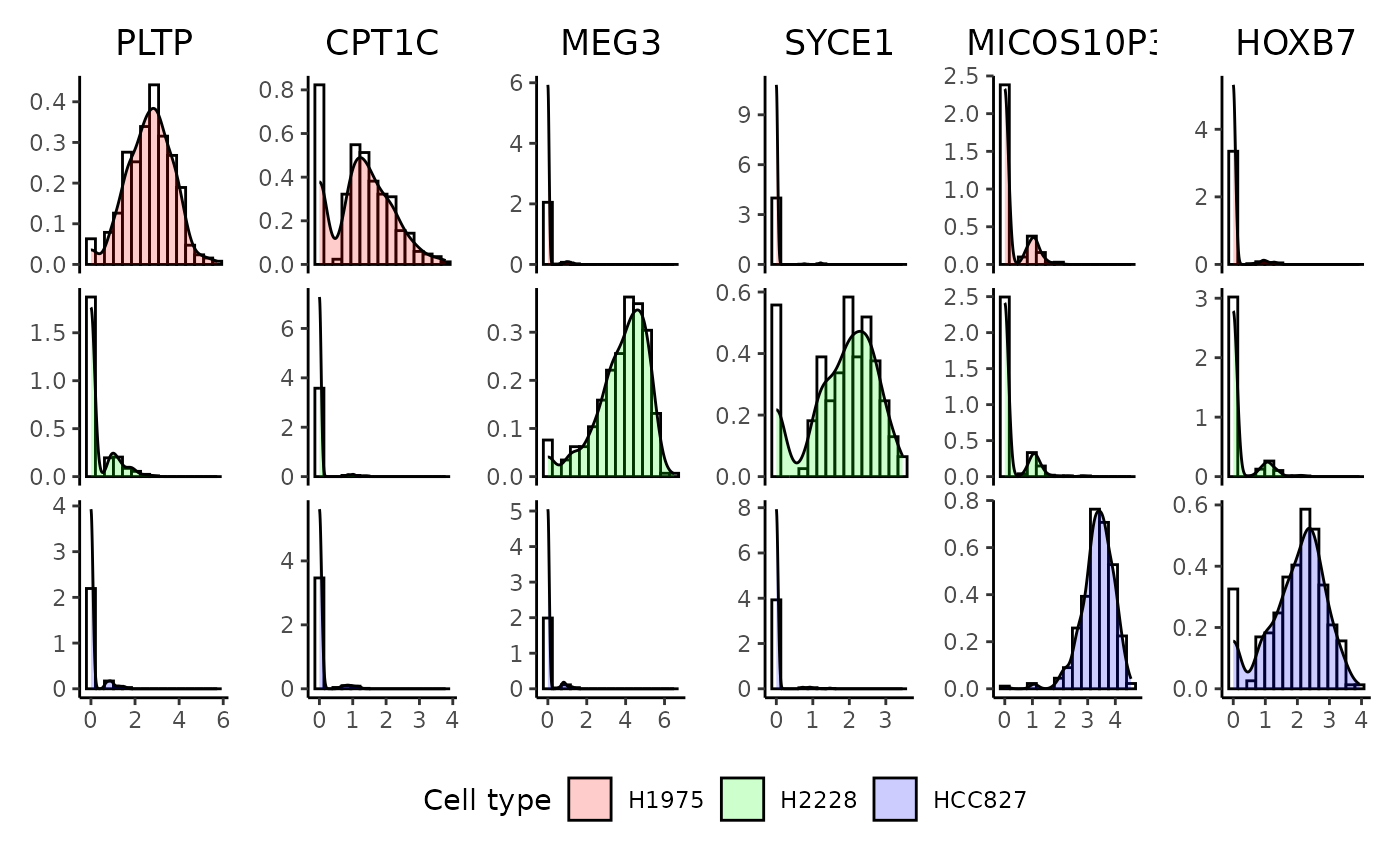
 plotDensities(
x = cellbench,
cepoOutput = cepoOutput,
genes = c('PLTP', 'CPT1C', 'MEG3', 'SYCE1', 'MICOS10P3', 'HOXB7'),
assay = 'logcounts',
plotType = 'histogram',
celltypeColumn = 'celltype'
)
plotDensities(
x = cellbench,
cepoOutput = cepoOutput,
genes = c('PLTP', 'CPT1C', 'MEG3', 'SYCE1', 'MICOS10P3', 'HOXB7'),
assay = 'logcounts',
plotType = 'histogram',
celltypeColumn = 'celltype'
)